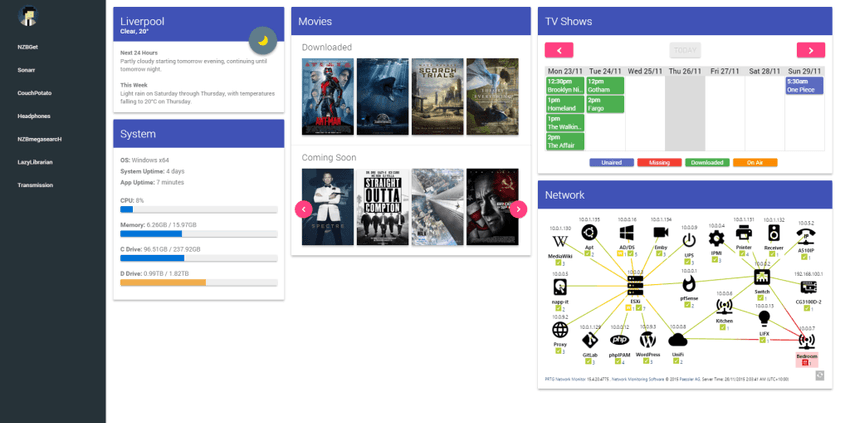
A personalised dashboard built using Google's Material Design.
I'm no developer but every year I like to update my personal Usenet dashboard into something better. Material Usenet Dashboard is able to provide:
- Network services and their status e.g. CouchPotato, Sonarr, NZBGet, Transmission
- TV Shows from Sonarr, and their status
- Movies from CouchPotato and their status
- The weather in a chosen location
- System information such as CPU, memory and disk usage
- An iFrame which can be filled with anything, but optimised for PRTG Network Maps
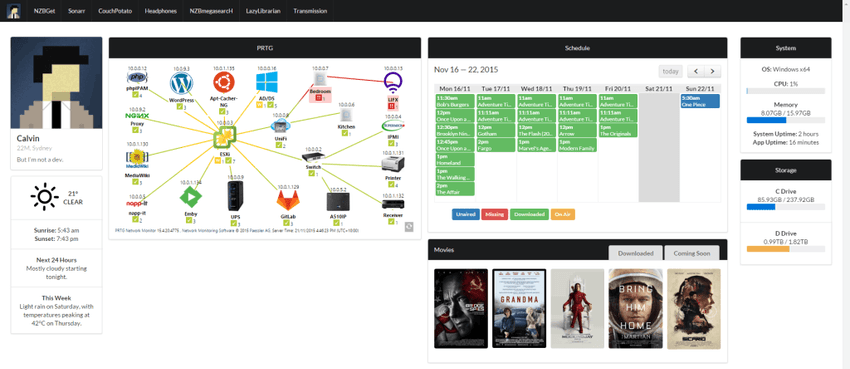
Here's V1 from 2014. It was reused a lot of code from d4rk22's Network Status Page. It was very simple, lightweight and got the job done, but the code was horrible as it was my first foray into PHP. You can see the differences between mine and his code from our pictures alone.
And then there was V2, built on Node.js, Express and AngularJS in mid 2015. It relied heavily on the Semantic UI framework. It was the second JavaScript application I've ever written and was a great learning experience at the same time. Some logic was reused from V1 but overall it was complete rewrite. New additions included the calendar from Sonarr, Movies from CouchPotato and an iFrame into PRTG.
Finally, V3, what it is today, an update to V2 with Google's Material Design, the Material Design Lite framework provided by Google themselves. There weren't many changes in V3 besides the UI overall. The only one that stands out would be from LightSlider to Slick Carousel for the movies section.
I have have never made the source code available for V1 or V2 but this time around I have released V3 onto GitHub. You can check out the really badly made demo here as well. All the instructions to set it up are on GitHub, but no support will be provided as it is a personal project which I don't intend for others to use.


